
")
")
")
")
")
")
")
")
")
")
Newsletters
Subscribe to our newsletter and get statistical data as soon as it is available!...
In June 2022
Madeira’s economy slowed down
The Regional Indicator Economic Activity Indicator (RIEA) shows that in June 2022 the regional economic activity continued to grow, albeit at a slower pace than in the previous month.
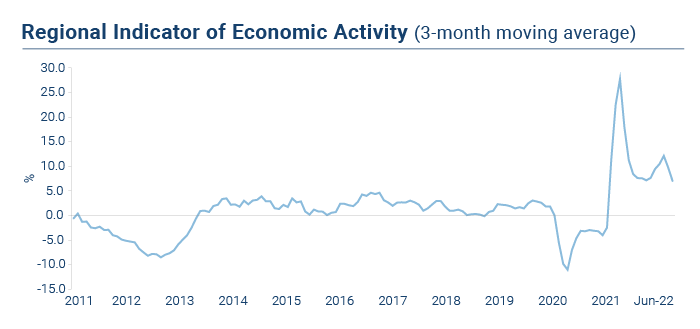
As mentioned in the first release of RIEA, in October 2017, its purpose is “to signal the behaviour of economic activity, namely concerning its direction and magnitude of fluctuations: whether it is in the positive or negative ground, accelerations, decelerations and the identification of turning points”. Therefore, its quantitative value assumes secondary importance, not being a substitute for the volume change of the Gross Domestic Product - determined with a more varied and complete set of statistical information - although there is a strong correlation between the two variables.
Monthly Economic Survey - The economic situation of the Autonomous Region of Madeira in June 2022 from 6 topics
DREM continues the brief analysis of the main short-term indicators, which started in December 2021. It should be noted that many of the indicators for June 2022 show a deceleration in growth, which is due to the progressive normalization of the economic activity that took place in the same period of the previous year.
Economic activity
As mentioned above, RIEA shows that, in June 2022, the regional economic activity continued to grow, although less sharply than in the previous month.
The recovery of the tourism sector contributed to this performance, with overnight stays (excluding local accommodation under 10 beds) increasing by 290.5% in that month.
Electricity distribution – an indicator closely associated with the economic activity – although growing by 10.6%, decelerated compared to the previous month. The diesel released for consumption grew by 7.4% in June 2022 against the 13.3% recorded in the previous month.
When analysing the ratio of formed and dissolved companies, it is noted that in June 2022, for each company dissolved in the Region, 2.4 new companies were formed, well above that ratio recorded in the previous month (1.8).
Private consumption
One of the indicators related to private consumption is the operations on the SIBS network with the cards issued by the national banks. Analysing the amount of withdrawals and purchases through automatic payment terminals (APT) using this type of card, there was a growth of 15.2% in June 2022, although at a level slightly lower than in the previous month (16.1% ).
The gasoline released for consumption also slowed down in the month of reference, rising by 14.6% year-on-year (25.5% in May 2022).
In turn, in June 2022, sales of new passenger vehicles grew by 45.5%, a lower change compared to the previous month (+56.1%).
Investment
All indicators available for the investment domain are growing in June 2022: building permits by 39.8%, bank appraisals on housing by 9.7%, cement sales by 9.2% and housing loans by 3.8%.
External demand
Although trade with foreign countries represents only a small part of the Region's total trade (most of it is with the mainland), it should be noted that both exports (+40.8%) and imports of goods (+32.7%) show the same trend as the movement of goods in ports (+16.6%), the most comprehensive indicator of the dynamics of trade with foreign countries. Among the remaining indicators, the growth of passengers in airports (+250.6%) is in line with withdrawals and purchases through APT using international cards, , +163.0% in June 2022 (+193.9% in the previous month).
Labour Market
Data from the organisations responsible for employment in the country and the Region show, in June 2022, an increase in job offers (+44.0%) and a decrease in job applications (-20.9%) and registered unemployed (-20.7%).
Prices
In June 2022, the year-on-year inflation rate accelerated, reaching 8.8%, being more pronounced for goods (+9.9%) than for services (+7.0%). The underlying inflation rate (which excludes unprocessed food and energy) was 7.1%.
For more information, please click on:
International Statistical Cooperation
 |
International Statistical Cooperation
|
Statistical Literacy
 |
Statistical Literacy
|
|
|
|
|
|
|

Copyright © 2026 Direção Regional de Estatística da Madeira. All rights reserved.
Address: Calçada de Santa Clara 38, 9004-545 Funchal, Madeira Island
Phone: +351 291 145 126 (National landline call)