
")
")
")
")
")
")
")
")
")
")
Newsletters
Subscribe to our newsletter and get statistical data as soon as it is available!...
In 2025
Proportion of persons affected by most material and social deprivations due to economic conditions decreased, while housing overcrowding increased
The Regional Directorate of Statistics of Madeira (DREM) releases today a set of data from the Survey on Income and Living Conditions (SILC) carried out in 2025, complementing the information released at the end of last year. Indicators on material and social deprivation, as well as housing deprivation and energy poverty, are made available.
Based on the national poverty line, approximately 43.2 thousand residents in the Autonomous Region of Madeira (ARM) were at-risk-of-poverty in 2024, reflecting a decrease of 11.7% compared to the previous year. This corresponds to an at-risk-of-poverty rate of 16.6%, 2.5 percentage points (pp) lower than in 2023 (19.1%), although still above the national average (15.4%; -1.2 pp compared to 2023).
Material and social deprivation indicators
Within the framework of the Europe 2030 strategy, the concept of material and social deprivation was defined for monitoring poverty and social exclusion. These indicators are based on a set of thirteen items (difficulties) related to households’ social and economic needs and durable goods, as well as aspects concerning individual well-being (new clothing, footwear and pocket money), leisure and social interaction. Of the thirteen items, seven relate to the household as a whole and six to the personal level.
Difficulties at the household level:
- Lack of capacity to immediately cover an unexpected expense close to the monthly value of the poverty line (without asking for financial help).
- Lack of capacity to pay for a week of vacation per year, away from home, covering accommodation and travel expenses for all members of the household.
- Delay, due to economic difficulties, in any regular payments related to rent, credit instalments, or current expenses of the main residence, or other expenses not related to the main residence.
- Lack of financial capacity to have a meal of meat or fish (or a vegetarian equivalent) at least every 2 days.
- Lack of financial capacity to keep the house adequately heated.
- Unavailability of a car (passenger or mixed) due to economic difficulties.
- Inability to replace used furniture.
Difficulties at the personal level (16 years or older):
- Inability to replace used clothing with some new clothing (excluding second-hand clothing).
- Inability to have two pairs of shoes of suitable size (including one pair of shoes for all weather conditions).
- Inability to spend a small amount of money on oneself weekly.
- Inability to participate regularly in a leisure activity.
- Inability to meet friends/family for a drink/meal at least once a month.
- Inability to have access to the internet for personal use at home.
For household-level items, the deprivation status is attributed to all members regardless of age. For items of deprivation collected at the personal level, children under 16 are considered deprived if at least half of the household members aged 16 or over report deprivation. This indicator distinguishes between households that are unable to access certain goods and services (enforced deprivation) and those that do not wish to or do not consider them necessary.
For 10 of the 13 items, a decrease was observed in 2025 in the proportion of persons affected by most limitations due to economic hardship, compared to 2024. Exceptions were the proportion of persons unable to spend a small weekly amount on themselves (8.3%; +0.4 pp) and those without access to the internet for personal use at home (1.2%; +0.2 pp).
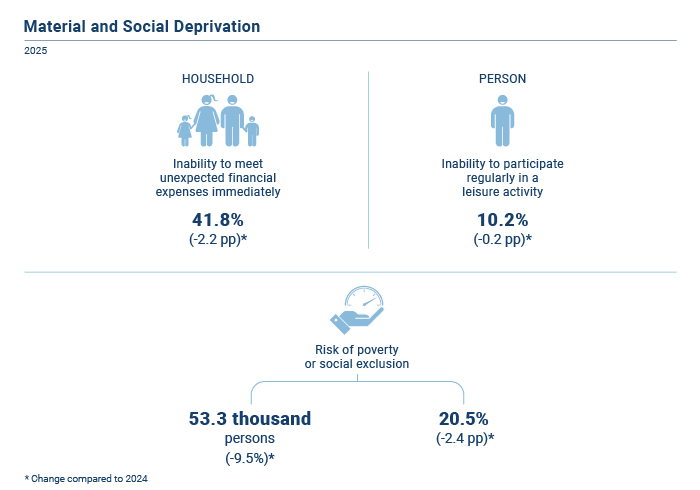
Among the main difficulties at the household level were: inability to afford one week of annual holiday away from home (44.4%), inability to replace worn-out furniture (43.4%), and inability to meet unexpected expenses close to the monthly poverty line (632 euros) without borrowing (41.8%). At the personal level, notable constraints included the inability to participate regularly in leisure activities (10.2%), the inability to spend a small weekly amount on oneself (8.3%), and the inability to replace worn-out clothing with new items (7.4%).
The Europe 2030 strategy defines an indicator to monitor the population at risk of poverty or social exclusion, combining relative poverty, severe material and social deprivation, and very low work intensity per capita. In accordance with European conventions, the reference year corresponds to that of severe material and social deprivation, although relative poverty remains the determining factor in its trajectory.
In 2025, approximately 53.3 thousand residents were at-risk-of-poverty or social exclusion, 5.6 thousand fewer than in 2024 (-9.5%). The rate stood at 20.5%, reflecting a decrease of 2.4 pp compared to 2024. At the national level, the rate was 18.6%, down by 1.1 pp from the previous year.
Although the available time series for these variables is relatively short, it is noteworthy that, in all cases, the values recorded represent the lowest in the series.
Housing deprivation indicators
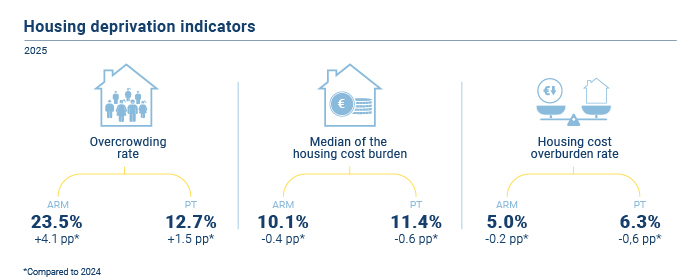
The housing overcrowding rate corresponds to the proportion of persons living in dwellings where the number of habitable rooms (≥ 4 m²) is insufficient for the size and demographic composition of the household. In 2025, this rate stood at 23.5%, an increase of 4.1 pp compared to the previous year. The national average was 12.7%, 1.5 pp higher than in 2024.
The severe housing deprivation rate reflects the proportion of persons living in overcrowded dwellings who reported at least one of the following issues: lack of bath/shower and flush toilet inside the dwelling; leaking roof, damp walls, or rot in window frames or floors; insufficient natural light on a sunny day. In 2025, this rate was 11.3%, increasing by 1.0 pp compared to 2024. The national average stood at 6.1% (4.9% in 2024).
The housing cost overburden relates annual housing expenditure to household disposable income, net of housing social transfers. These costs include water, electricity, gas or other fuels, condominium fees, insurance, sanitation, minor repairs, rent, and mortgage interest. In 2025, a decrease was observed in this ratio, with a median burden of 10.1% (10.5% in 2024), below the national figure (11.4%). The housing cost overburden rate stood at 5.0% (5.2% in 2024), also below the national level (6.3%)
Energy poverty indicators
The analysis of housing deprivation indicators collected through SILC also allows for the assessment of energy poverty. These data reflect households’ ability to keep their homes adequately warm, meet regular housing-related payments, and live in adequate physical conditions, including the absence of roof leaks, damp walls, or structural deterioration.
In 2025, the proportion of the population unable to keep their home adequately warm stood at 19.7%, the lowest value since the series began in 2018. This represents a decrease of 1.1 pp compared to 2024 and 3.6 pp compared to 2018. However, among the population at risk of poverty, the situation worsened, reaching 35.7% in 2025 (+2.3 pp compared to 2024 and +1.9 pp compared to 2018).
Regarding arrears in housing payments due to financial difficulties, the proportion stood at 4.2% in 2025, decreasing by 1.9 pp from the previous year and by 5.7 pp compared to 2018, representing the lowest value in the series. Among the population at-risk-of-poverty, this proportion was 8.4%, decreasing by 1.5 pp compared to 2024 and by 10.5 pp compared to 2018.
Concerning the physical conditions of dwellings, the proportion of residents living in homes with leaking roofs, damp walls, or rot in windows or floors increased to 41.3%, up by 1.9 pp compared to 2024, though down by 5.6 pp compared to 2018 (46.9%). This situation is more pronounced among those at risk of poverty, where the proportion reached 55.1%, reversing the improvement observed in 2024 (49.0%) and remaining above the 2018 level (53.0%).
For more information, please click on:
International Statistical Cooperation
 |
International Statistical Cooperation
|
Statistical Literacy
 |
Statistical Literacy
|
|
|
|
|

|
|

Copyright © 2026 Direção Regional de Estatística da Madeira. All rights reserved.
Address: Calçada de Santa Clara 38, 9004-545 Funchal, Madeira Island
Phone: +351 291 145 126 (National landline call)