
")
 (Read more...)")
")
")
")
")
")
")
")
")
Newsletters
Subscribe to our newsletter and get statistical data as soon as it is available!...
DREM releases Public Expenditure Statistics for the period 2010-2024
The Regional Directorate of Statistics of Madeira (DREM) today releases a set of data concerning public expenditure of the Regional Administration of Madeira for the period 2010 to 2024, based on the 2021 benchmark of the Portuguese National Accounts. Note that for some information, the latest year available is 2023.
The conceptual framework of public expenditure statistics and the terminology employed are underpinned by the European System of Accounts (ESA 2010) and the Manual on Government Finance Statistics (GFSM) for the classification of public expenditure by functions (COFOG). It should also be emphasised that the institutional subsector of the Regional Administration of Madeira (RAM) encompasses the Regional Government and the Autonomous Services and Funds, which include, for instance, Public Institutes and reclassified Enterprises within the scope of Public Administrations.
Aggregate Public Expenditure – Public expenditure by the Regional Administration of Madeira rose in 2023, yet its share in GDP declined
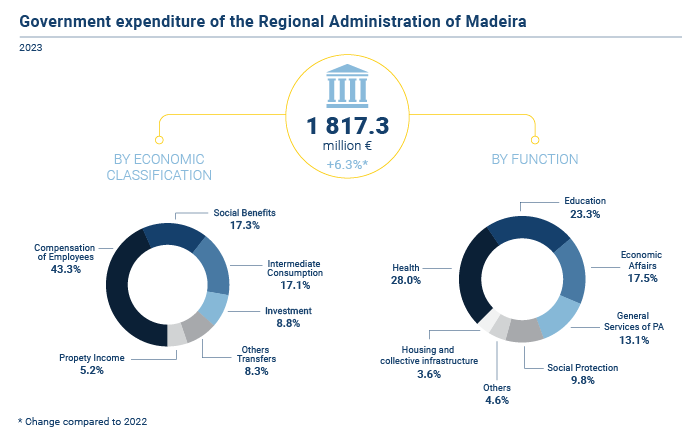
In 2023, the nominal value of public expenditure of the RAM amounted to 1 817.3 million euros, representing an increase of 6.3% compared with the previous year. However, given the significant nominal growth of Gross Domestic Product (GDP) in 2023, the share of regional public expenditure in GDP declined to 26.0%, i.e., 1.3 percentage points (pp) less than in 2022. Nationally, this ratio stood at 42.3% in 2023, a decrease of 1.6 pp compared with the previous year.
In 2024, for which the regional GDP figure has not yet been published by Statistics Portugal (INE), the nominal value of the RAM expenditure reached approximately 1 905.4 million euros, corresponding to a growth of 4.8% compared to 2023.
Economic Classification of Expenditure – In 2024, wages drove expenditure growth with a 6.2% rise, while other transfers notably declined by 12.7%
From the perspective of the economic classification of public expenditure, the three largest components are wages, social benefits, and intermediate consumption, which in 2023 represented 11.3%, 4.5% and 4.4% of GDP, respectively. In terms of their share of total expenditure, these components accounted for 43.3%, 17.3% and 17.1%, in the same order.
In 2024, wages represented 43.9% of total expenditure (+0.6 pp compared with 2023), followed by social benefits at 17.3% (the same as in the previous year), and intermediate consumption, which accounted for 16.3% of total expenditure, i.e. -0.8 pp compared with 2023.
In 2023, expenditure on wages amounted to 787.3 million euros (+11.1% compared to 2022), while in 2024 this component reached 835.9 million euros (+6.2% compared to 2023).
Intermediate consumption amounted to 310.8 million euros in 2023, an increase of 17.3% over the previous year. In 2024, this item rose slightly to 311.0 million euros (+0.1% compared to 2023).
Social benefits increased by 4.0% in 2023, reaching 314.5 million euros. In 2024, this item rose to 329.9 million euros (+4.9% compared with the previous year).
It is also noteworthy that, in 2024, property income (mainly interest payments) returned to levels observed prior to the pandemic, amounting to 95.1 million euros. Investment expenditure of the RAM increased between 2022 and 2024, rising from 153.2 million euros in 2022 to 159.8 million euros in 2023 (+4.4%), and again in 2024 to 202.6 million euros (+26.7%).
Other transfers (subsidies; other current transfers; and capital transfers) fell by 27.3% between 2022 and 2023, totalling 149.5 million euros in that year. In 2024, this item declined further by 12.6% to 130.7 million euros.
Classification of Expenditure by Function – Health and Education together accounted for more than 50% of total expenditure in 2023
In addition to the economic classification, public expenditure may also be classified by function (COFOG), as described in the methodological note at the end of this document. The functional classification employed here is that recommended by ESA 2010. This classification complements the economic classification by providing information on the purposes of expenditure, thereby broadening the analytical framework for assessing the quality of public expenditure.
In 2023, the functions with the greatest share in GDP were Health (7.3%) and Education (6.1%). These were followed by Economic Affairs, General Public Services (which include interest payments), and Social Protection, with shares in GDP of 4.6%, 3.4% and 2.6%, respectively. In terms of total expenditure, Health and Education accounted for 28.0% and 23.3%, respectively, while Economic Affairs, General Public Services, and Social Protection represented 17.5%, 13.1% and 9.8%, in the same order.
Analysing the evolution of expenditure by major functions between 2022 and 2023, increases were recorded in Housing and Community Amenities (+53.9%), General public services (+23.0%), Recreation, Culture and Religion (+19.6%), Public Order and Safety (+19.1%), Health (+12.7%), Education (+9.6%), Environmental Protection (+5.6%), and Social Protection (+4.2%). Conversely, only the function Economic Affairs (-18.6%) registered a decline in expenditure.
For more information, please refer to:
International Statistical Cooperation
 |
International Statistical Cooperation
|
Statistical Literacy
 |
Statistical Literacy
|
|
|
|
|
|
|

Copyright © 2026 Direção Regional de Estatística da Madeira. All rights reserved.
Address: Calçada de Santa Clara 38, 9004-545 Funchal, Madeira Island
Phone: +351 291 145 126 (National landline call)