![]()
![]()

")
")
")
")
")
")
")
")
")
")
Subscribe to our newsletter and get statistical data as soon as it is available!...
|
Resident Population Resident Population Estimates (31 December) adjusted to the final results of the 2021 Census (thousands). |
|
2021 - 2024, Provisional Resident Population Estimates - post-census estimates based on the 2021 Census results. Source: Statistics Portugal/DREM - Demographic Statistics |
|
Unemployment Rate Quarterly rate obtained from the Labour Force Survey, corresponding to the ratio of the unemployed population to the active population (%). |
|
Source: Statistics Portugal/DREM - Labour Force Survey |
|
Inflation Rate Average Rate of Change over the last 12 months of the Consumer Price Index (%). |
|
Source: Statistics Portugal/DREM - Consumer Price Index |
|
Overnight Stays Overnight stays recorded in total collective tourist accommodation (thousands). |
|
Source: Statistics Portugal/DREM - Tourism Statistics |
|
GDP Gross Domestic Product (GDP) of the Autonomous Region of Madeira at current prices, base 2021 (million euros). |
|
The value for 2024 is provisional. Source: Statistics Portugal - Regional Accounts (Base 2021) |
|
Family Dwelling Sales Number of Family Dwelling Sales (Total, New and Existing) in the Autonomous Region of Madeira. |
|
Source: Statistics Portugal (INE, IP.). |
|
Company Incorporation and Dissolution Number of companies incorporated and dissolved. |
|
Source: Directorate-General for Justice Policy |
|
Natural Balance Difference between the number of live births and the number of deaths in a given period of time (No.). |
|
* Preliminary data compiled up to 10th April 2026. Source: Statistics Portugal/DREM - Demographic Statistics |
|
Regional Indicator of Economic Activity 3-month moving average (%). |
|
Source: DREM |
|
Population Resident Population estimates by the 31st of December which incorporate the 2021 Census final results (thousands). |
|
2021 - 2024, Provisional Resident Population Estimates, post-census estimates based on the results of the 2021 Census. Source: INE/DREM - Demographic Statistics |
|
Unemployment Rate Quarterly rate derived from the Labour Fource Survey, which corresponds to the ratio between the unemployed and the active population(%). |
|
Source: INE/DREM - Labour Force Survey |
|
Inflation Rate 12-month average growth rate of the Consumer Price Index. |
|
Source: INE/DREM - Consumer Price Index |
|
Overnight stays Overnight stays in tourism accommodation (thousands). |
|
Source: INE/DREM - Tourism Statistics |
|
GDP Gross Domestic Product (GDP) of the Autonomous Region of Madeira at current prices, base 2021 (millions of euros). |
|
The value for 2024 is provisional. Source: INE - Regional Accounts (Base 2021) |
|
Dwelling Sales Number of Dwelling Sales (Total, New e Existing), in the Autonomous Region of Madeira. |
|
Source: Statistics Portugal |
|
Formation and Dissolution of Companies Number of formed and dissolved companies. |
|
Source: Directorate-General for Justice Policy |
|
Natural Change Balance between the number of live births and the number of deaths in a given time period (No.). |
|
* Preliminary data compiled up until April 10th, 2026. Source: INE/DREM - Demographic Statistics |
|
Regional Indicator of Economic Activity 3-month moving average (%). |
|
Source: DREM |
Annual publication
Price: papel - 3,50 € / PDF - Free
Year of publication: 2024
Reference period: 2023
Quarterly Bulletin of Statistics
Quarterly publication
Price: paper - 4,00 € / PDF - Free
Year of publication: 2025
Reference period: 2nd Quarter 2025
Annual publication
Price: paper - 22,00 € / PDF - Free
Year of publication: 2024
Reference period: 2023

Census - Final results: Autonomous Region of Madeira - 2021
Annual publication
Price: paper - 10,00 € / PDF - Free
Year of publication: 2023
Reference period: 2021
Annual publication
Price: PDF - Free
Year of publication: 2026
Reference period: 2025
Monthly publication
Price: paper - 3,00 € / PDF - Free
Year of publication: 2025
Reference period: December 2024
Annual publication
Price: paper - 10,00 € / PDF - Free
Year of publication: 2024
Reference period: 2023

Annual publication
Price: paper- 12,00 € / PDF - Free
Year of publication: 2024
Reference period: 2022

International Trade Statistics
Annual publication
Price: paper- 6,00 € / PDF - Free
Year of publication: 2021
Reference period: 2020
Quarterly publication
Price: paper- 2,00 € / PDF - Free
Year of publication: 2025
Reference period: 4th Quarter 2024

Annual publication
Price: paper - 4,00 € / PDF - Free
Year of publication: 2024
Reference period: 2023

Agriculture and Fishery Statistics
Annual publication
Price: paper - 3,50 € / PDF - Free
Year of publication: 2024
Reference period: 2023

Annual publication
Price: paper - 12,00 € / PDF - Free
Year of publication: 2021
Reference period: 2019
Construction and Housing Statistics
Annual publication
Price: paper - 4,50 € / PDF - Free
Year of publication: 2024
Reference period: 2023
Annual publication
Price: paper - 3,50 € / PDF - Free
Year of publication: 2024
Reference period: 2023

Annual publication
Price: paper - 22,00 € / PDF - Free
Year of publication: 2023
Reference period: 2022
Monthly publication
Price: paper - 1,50 € / PDF - Free
Year of publication: 2025
Reference period: May 2025
Annual publication
Price: paper - 10,00 € / PDF - Free
Year of publication: 2024
Reference period: 2023
International Trade Statistics
Annual publication
Price: paper - 6,00 € / PDF - Free
Year of publication: 2021
Reference period: 2020
Annual publication
Price: paper - 4,00 € / PDF - Free
Year of publication: 2024
Reference period: 2023
Annual publication
Price: paper - 12,00 € / PDF - Free
Year of publication: 2021
Reference period: 2019
Quarterly Bulletin of Statistics
Quarterly publication
Price: paper - 4,00 € / PDF - Free
Year of publication: 2025
Reference period: 2nd Quarter 2025
Census - Final results. Autonomous Region of Madeira - 2021
Annual publication
Price: paper - 10,00 € / PDF - Free
Year of publication: 2023
Reference period: 2021
Construction and Housing Statistics
Annual publication
Price: paper - 4,50 € / PDF - Free
Year of publication: 2023
Reference period: 2022
Agriculture and Fishery Statistics
Annual publication
Price: paper - 3,50 € / PDF - Free
Year of publication: 2024
Reference period: 2023
Quarterly publication
Price: paper - 2,00 € / PDF - Free
Year of publication: 2025
Reference period: 4th Quarter 2024
Annual publication
Price: paper - 12,00 € / PDF - Free
Year of publication: 2024
Reference period: 2022
Monthly publication
Price: paper - 3,00 € / PDF - Free
Year of publication: 2025
Reference period: December 2024
In September 2024
Regional economic growth accelerated for the second consecutive month
The Regional Economic Activity Indicator (RIEA) shows that, in September 2024, the regional economic activity continued its positive growth trajectory, with the RIEA accelerating for the second consecutive month.
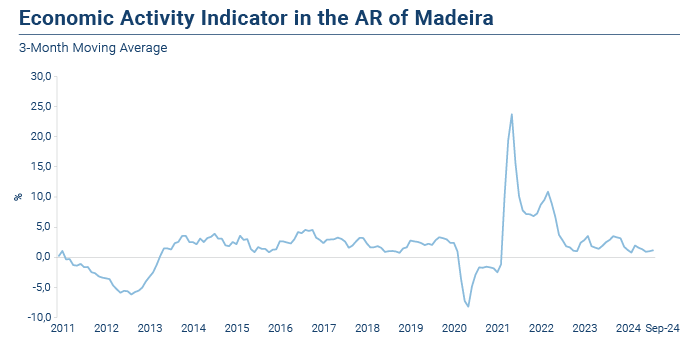
As previously mentioned in the first release of the RIEA, in October 2017, the purpose of the indicator is to "signal the behaviour of economic activity, particularly regarding the direction and magnitude of fluctuations: whether it is in positive or negative territory, accelerations, decelerations, and the identification of turning points." Therefore, its quantitative value assumes secondary importance, as it is not intended to replace the actual variation in Gross Domestic Product (GDP), which should be assessed with a more comprehensive set of statistical information, although there is a strong correlation between the two variables.
Economic Overview for September 2024 – 7 Topics
The Regional Directorate of Statistics of Madeira presents a concise analysis of the main short-term indicators, divided into themes. It is important to note that many of the changes mentioned refer to three-month moving averages, a common technique in economic reports to smooth out irregularities and reveal trends.
1. Economic Activity
As previously mentioned, regional economic activity in September 2024 maintained its positive growth trajectory, at a pace higher than in the previous month.
The tourism sector contributed to economic growth, as overnight stays (excluding local accommodation with fewer than 10 beds) increased by 0.7% in September 2024 (1.5% in August). Additionally, total revenue in tourist accommodation increased by 13.6%, the same as in the previous month.
Electricity distribution, an indicator closely linked with economic growth, grew by 1.6% in September 2024 (1.1% in August). Diesel released for consumption decreased by 0.2%, a smaller drop compared to the 0.4% decrease in August.
Regarding the ratio of incorporated and dissolved companies, in September 2024, 3.2 new companies were incorporated for every dissolved company in the region, a higher proportion than the 2.3 observed in the previous month.
2. Qualitative Indicators
The available confidence indicators for September 2024, compared to the previous month, show an increase in the construction and public works sector and decreases in trade, manufacturing, and services sectors.
3. Private Consumption
One of the indicators reflecting the evolution of private consumption is the amounts of transactions in the SIBS network with cards issued by national banks. Analysing the total cash withdrawals from ATMs and purchases made with national cards at payment terminals, a 5.9% increase was observed in September 2024, slightly above the 5.7% recorded in the previous month.
Gasoline released for consumption slowed slightly, with an increase of 9.6% in September 2024, compared to 10.5% in August. The purchase of light passenger cars by residents increased by 4.7%, below the 5.1% growth seen in August.
The balance of consumer loans granted to families and non-profit institutions for household purposes accelerated by 6.3% in September 2024, breaking a 12-month cycle of declines (-11.8% in the previous month).
4. Investment
Regarding investment, the indicators for September 2024 can be divided into two groups: those with a positive trend, such as sales of light goods vehicles, which grew by 23.2% (-17.6% in the previous month), housing bank appraisals, which rose by 13.8% (compared to 15.9% in the previous month), the balance of loans granted to households for housing, which increased by 1.8% (up from 1.2% in August), and cement sales, which grew by 5.8% after a 9.8% increase in August 2024. On the other hand, there were indicators showing a decline, such as the balance of loans granted to non-financial corporations, which decreased by 6.5% (-7.7% in August 2024), and building permits, which fell by 16.5% (-34.3% in the previous month).
5. External Demand
Although trade with foreign countries represents only a small portion of the Region's total trade (the majority of which is with the mainland), it is important to note that both exports (32.5%; 23.8% in August) and imports of goods increased (1.6%; 4.9% in August).
The movement of goods at the ports (10.2%; 7.1% in the previous month), which is a more comprehensive indicator of external trade dynamics, accelerated compared to the previous month.
Other indicators show a slowdown in passenger movement at airports (3.4%; 5.1% in August), in line with the evolution of total ATM withdrawals and purchases made with international cards at payment terminals (17.3%; 19.2% in the previous month).
6. Labour Market
Data from employment authorities at both the national and regional levels show that, in September 2024, there was a slight decrease in job offers (-0.3%) and an increase in both job applications (8.2%) and the number of registered unemployed persons (7.1%).
7. Prices
In September 2024, the year-on-year inflation rate stood at 3.8%, accelerating from the previous month (3.5%), with lower inflation in goods (2.1%) and higher inflation in services (6.0%). The underlying inflation rate (excluding non-processed food and energy products) was 4.5%, up from 4.4% in August.
For more information, visit:
 |
|
 |
|

![]()


|
|
|
|
|
|
Copyright © 2026 Direção Regional de Estatística da Madeira. All rights reserved.
Address: Calçada de Santa Clara 38, 9004-545 Funchal, Madeira Island
Phone: +351 291 145 126 (National landline call)
