![]()
![]()

")
")
")
")
")
")
")
")
")
")
Subscribe to our newsletter and get statistical data as soon as it is available!...
|
Resident Population Resident Population Estimates (31 December) adjusted to the final results of the 2021 Census (thousands). |
|
2021 - 2024, Provisional Resident Population Estimates - post-census estimates based on the 2021 Census results. Source: Statistics Portugal/DREM - Demographic Statistics |
|
Unemployment Rate Quarterly rate obtained from the Labour Force Survey, corresponding to the ratio of the unemployed population to the active population (%). |
|
Source: Statistics Portugal/DREM - Labour Force Survey |
|
Inflation Rate Average Rate of Change over the last 12 months of the Consumer Price Index (%). |
|
Source: Statistics Portugal/DREM - Consumer Price Index |
|
Overnight Stays Overnight stays recorded in total collective tourist accommodation (thousands). |
|
Source: Statistics Portugal/DREM - Tourism Statistics |
|
GDP Gross Domestic Product (GDP) of the Autonomous Region of Madeira at current prices, base 2021 (million euros). |
|
The value for 2024 is provisional. Source: Statistics Portugal - Regional Accounts (Base 2021) |
|
Family Dwelling Sales Number of Family Dwelling Sales (Total, New and Existing) in the Autonomous Region of Madeira. |
|
Source: Statistics Portugal (INE, IP.). |
|
Company Incorporation and Dissolution Number of companies incorporated and dissolved. |
|
Source: Directorate-General for Justice Policy |
|
Natural Balance Difference between the number of live births and the number of deaths in a given period of time (No.). |
|
* Preliminary data compiled up to 10th April 2026. Source: Statistics Portugal/DREM - Demographic Statistics |
|
Regional Indicator of Economic Activity 3-month moving average (%). |
|
Source: DREM |
|
Population Resident Population estimates by the 31st of December which incorporate the 2021 Census final results (thousands). |
|
2021 - 2024, Provisional Resident Population Estimates, post-census estimates based on the results of the 2021 Census. Source: INE/DREM - Demographic Statistics |
|
Unemployment Rate Quarterly rate derived from the Labour Fource Survey, which corresponds to the ratio between the unemployed and the active population(%). |
|
Source: INE/DREM - Labour Force Survey |
|
Inflation Rate 12-month average growth rate of the Consumer Price Index. |
|
Source: INE/DREM - Consumer Price Index |
|
Overnight stays Overnight stays in tourism accommodation (thousands). |
|
Source: INE/DREM - Tourism Statistics |
|
GDP Gross Domestic Product (GDP) of the Autonomous Region of Madeira at current prices, base 2021 (millions of euros). |
|
The value for 2024 is provisional. Source: INE - Regional Accounts (Base 2021) |
|
Dwelling Sales Number of Dwelling Sales (Total, New e Existing), in the Autonomous Region of Madeira. |
|
Source: Statistics Portugal |
|
Formation and Dissolution of Companies Number of formed and dissolved companies. |
|
Source: Directorate-General for Justice Policy |
|
Natural Change Balance between the number of live births and the number of deaths in a given time period (No.). |
|
* Preliminary data compiled up until April 10th, 2026. Source: INE/DREM - Demographic Statistics |
|
Regional Indicator of Economic Activity 3-month moving average (%). |
|
Source: DREM |
Annual publication
Price: papel - 3,50 € / PDF - Free
Year of publication: 2024
Reference period: 2023
Quarterly Bulletin of Statistics
Quarterly publication
Price: paper - 4,00 € / PDF - Free
Year of publication: 2025
Reference period: 2nd Quarter 2025
Annual publication
Price: paper - 22,00 € / PDF - Free
Year of publication: 2024
Reference period: 2023

Census - Final results: Autonomous Region of Madeira - 2021
Annual publication
Price: paper - 10,00 € / PDF - Free
Year of publication: 2023
Reference period: 2021
Annual publication
Price: PDF - Free
Year of publication: 2026
Reference period: 2025
Monthly publication
Price: paper - 3,00 € / PDF - Free
Year of publication: 2025
Reference period: December 2024
Annual publication
Price: paper - 10,00 € / PDF - Free
Year of publication: 2024
Reference period: 2023

Annual publication
Price: paper- 12,00 € / PDF - Free
Year of publication: 2024
Reference period: 2022

International Trade Statistics
Annual publication
Price: paper- 6,00 € / PDF - Free
Year of publication: 2021
Reference period: 2020
Quarterly publication
Price: paper- 2,00 € / PDF - Free
Year of publication: 2025
Reference period: 4th Quarter 2024

Annual publication
Price: paper - 4,00 € / PDF - Free
Year of publication: 2024
Reference period: 2023

Agriculture and Fishery Statistics
Annual publication
Price: paper - 3,50 € / PDF - Free
Year of publication: 2024
Reference period: 2023

Annual publication
Price: paper - 12,00 € / PDF - Free
Year of publication: 2021
Reference period: 2019
Construction and Housing Statistics
Annual publication
Price: paper - 4,50 € / PDF - Free
Year of publication: 2024
Reference period: 2023
Annual publication
Price: paper - 3,50 € / PDF - Free
Year of publication: 2024
Reference period: 2023

Annual publication
Price: paper - 22,00 € / PDF - Free
Year of publication: 2023
Reference period: 2022
Monthly publication
Price: paper - 1,50 € / PDF - Free
Year of publication: 2025
Reference period: May 2025
Annual publication
Price: paper - 10,00 € / PDF - Free
Year of publication: 2024
Reference period: 2023
International Trade Statistics
Annual publication
Price: paper - 6,00 € / PDF - Free
Year of publication: 2021
Reference period: 2020
Annual publication
Price: paper - 4,00 € / PDF - Free
Year of publication: 2024
Reference period: 2023
Annual publication
Price: paper - 12,00 € / PDF - Free
Year of publication: 2021
Reference period: 2019
Quarterly Bulletin of Statistics
Quarterly publication
Price: paper - 4,00 € / PDF - Free
Year of publication: 2025
Reference period: 2nd Quarter 2025
Census - Final results. Autonomous Region of Madeira - 2021
Annual publication
Price: paper - 10,00 € / PDF - Free
Year of publication: 2023
Reference period: 2021
Construction and Housing Statistics
Annual publication
Price: paper - 4,50 € / PDF - Free
Year of publication: 2023
Reference period: 2022
Agriculture and Fishery Statistics
Annual publication
Price: paper - 3,50 € / PDF - Free
Year of publication: 2024
Reference period: 2023
Quarterly publication
Price: paper - 2,00 € / PDF - Free
Year of publication: 2025
Reference period: 4th Quarter 2024
Annual publication
Price: paper - 12,00 € / PDF - Free
Year of publication: 2024
Reference period: 2022
Monthly publication
Price: paper - 3,00 € / PDF - Free
Year of publication: 2025
Reference period: December 2024
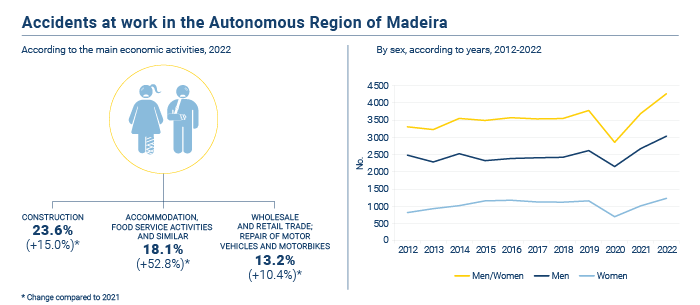
In 2022
Number of accidents at work in the Region increased by 15.7% over 2021
The Regional Directorate of Statistics of Madeira (DREM) makes available today on its website the statistical data series on Accidents at work, updated with the information from 2022.
According to the data provided by the Regional Directorate of Labour and Inspection Action (DRTAI) to DREM, in 2022, there were 4,265 accidents at work in the Autonomous Region of Madeira, up by 15.7% (+578 accidents) over 2021. Of the accidents that occurred in 2022, there were 3 fatal accidents, the same number as the previous year.
The "Construction" sector accounted for the highest number of accidents (23.6% of the total), followed by the "Accommodation and food service activities", with 18.1% and “Wholesale and retail trade; repair of motor vehicles and motorcycles" sector, with 13.2%. The "Accommodation and food service activities" sector recorded the largest absolute increase compared to 2021 (an increase of 267 accidents). In contrast, the "Public administration and defense; compulsory social security" observed the largest absolute decrease, with 23 fewer accidents (-10.9% than in 2021), representing 4.4% of the total accidents.
By gender and age groups, it is observed that in 2022, the majority of accidents occurred among men (71.1%) and in persons aged between 35 and 54 years (53.8%). The occupational groups with the highest number of injuries were "Building and Related Trades Workers (excluding Electricians)" (626 accidents; 14.7%) and " Personal Service Workers" (456 accidents; 10.7%).
Regarding the location of accidents, 20.5% of the accidents occurred in "Industrial sites" (874 accidents), 19.6% in “Tertiary activity area, office, amusement area, miscellaneous” (834 accidents) and 19.2% in "Construction site, construction, opencast quarry, opencast mine" (817 accidents). The most common cause of accidents was "Body movement under or with physical stress (generally leading to an internal injury)" (29.2% of the total accidents; 1,246).
The main direct events causing injury to the casualties were "Physical or mental stress" (26.4%; 1,125 accidents) and "Horizontal or vertical impact with or against a stationary object" (19.3%; 823 accidents).
As for the consequences of the accidents, it is noted that "Wounds and Superficial Injuries" and "Dislocations, Sprains and Strains" were the most prominent injuries, accounting for 52.2% and 39.2% of the total, respectively. About 3 out of every 5 accidents affected the "Upper extremities" or "Lower extremities" (34.5% and 27.9%, in the same order).
Regarding the number of days of absence from work, it should be noted that 25.8% of non-fatal accidents did not involve any absence from work. There were 124,120 days of lost work due to accidents at work, highlighting the range of 7 to 13 days of absence that stood out for 18.4% of the total non-fatal accidents. The highest number of days of work lost due to accidents at work occurred in the "Construction" sector (34,485 days, 27.8% of the total days lost) followed by “Accommodation and food service activities” (19,145 days, 15.4% of the total days lost). On average, 29 days of work were lost due to accidents, with the “Mining and quarrying” sector recording the highest average (60 days per accident), followed by the “Other service activities” and “Real estate activities” sectors, both with 49 days due to accident.
For more information, please click on:
 |
|
 |
|


![]()


|
|
|
|
|
|
Copyright © 2026 Direção Regional de Estatística da Madeira. All rights reserved.
Address: Calçada de Santa Clara 38, 9004-545 Funchal, Madeira Island
Phone: +351 291 145 126 (National landline call)
