![]()
![]()

")
")
")
")
")
")
")
")
")
")
Subscribe to our newsletter and get statistical data as soon as it is available!...
|
Resident Population Resident Population Estimates (31 December) adjusted to the final results of the 2021 Census (thousands). |
|
2021 - 2024, Provisional Resident Population Estimates - post-census estimates based on the 2021 Census results. Source: Statistics Portugal/DREM - Demographic Statistics |
|
Unemployment Rate Quarterly rate obtained from the Labour Force Survey, corresponding to the ratio of the unemployed population to the active population (%). |
|
Source: Statistics Portugal/DREM - Labour Force Survey |
|
Inflation Rate Average Rate of Change over the last 12 months of the Consumer Price Index (%). |
|
Source: Statistics Portugal/DREM - Consumer Price Index |
|
Overnight Stays Overnight stays recorded in total collective tourist accommodation (thousands). |
|
Source: Statistics Portugal/DREM - Tourism Statistics |
|
GDP Gross Domestic Product (GDP) of the Autonomous Region of Madeira at current prices, base 2021 (million euros). |
|
The value for 2024 is provisional. Source: Statistics Portugal - Regional Accounts (Base 2021) |
|
Family Dwelling Sales Number of Family Dwelling Sales (Total, New and Existing) in the Autonomous Region of Madeira. |
|
Source: Statistics Portugal (INE, IP.). |
|
Company Incorporation and Dissolution Number of companies incorporated and dissolved. |
|
Source: Directorate-General for Justice Policy |
|
Natural Balance Difference between the number of live births and the number of deaths in a given period of time (No.). |
|
* Preliminary data compiled up to 10th April 2026. Source: Statistics Portugal/DREM - Demographic Statistics |
|
Regional Indicator of Economic Activity 3-month moving average (%). |
|
Source: DREM |
|
Population Resident Population estimates by the 31st of December which incorporate the 2021 Census final results (thousands). |
|
2021 - 2024, Provisional Resident Population Estimates, post-census estimates based on the results of the 2021 Census. Source: INE/DREM - Demographic Statistics |
|
Unemployment Rate Quarterly rate derived from the Labour Fource Survey, which corresponds to the ratio between the unemployed and the active population(%). |
|
Source: INE/DREM - Labour Force Survey |
|
Inflation Rate 12-month average growth rate of the Consumer Price Index. |
|
Source: INE/DREM - Consumer Price Index |
|
Overnight stays Overnight stays in tourism accommodation (thousands). |
|
Source: INE/DREM - Tourism Statistics |
|
GDP Gross Domestic Product (GDP) of the Autonomous Region of Madeira at current prices, base 2021 (millions of euros). |
|
The value for 2024 is provisional. Source: INE - Regional Accounts (Base 2021) |
|
Dwelling Sales Number of Dwelling Sales (Total, New e Existing), in the Autonomous Region of Madeira. |
|
Source: Statistics Portugal |
|
Formation and Dissolution of Companies Number of formed and dissolved companies. |
|
Source: Directorate-General for Justice Policy |
|
Natural Change Balance between the number of live births and the number of deaths in a given time period (No.). |
|
* Preliminary data compiled up until April 10th, 2026. Source: INE/DREM - Demographic Statistics |
|
Regional Indicator of Economic Activity 3-month moving average (%). |
|
Source: DREM |
Annual publication
Price: papel - 3,50 € / PDF - Free
Year of publication: 2024
Reference period: 2023
Quarterly Bulletin of Statistics
Quarterly publication
Price: paper - 4,00 € / PDF - Free
Year of publication: 2025
Reference period: 2nd Quarter 2025
Annual publication
Price: paper - 22,00 € / PDF - Free
Year of publication: 2024
Reference period: 2023

Census - Final results: Autonomous Region of Madeira - 2021
Annual publication
Price: paper - 10,00 € / PDF - Free
Year of publication: 2023
Reference period: 2021
Annual publication
Price: PDF - Free
Year of publication: 2026
Reference period: 2025
Monthly publication
Price: paper - 3,00 € / PDF - Free
Year of publication: 2025
Reference period: December 2024
Annual publication
Price: paper - 10,00 € / PDF - Free
Year of publication: 2024
Reference period: 2023

Annual publication
Price: paper- 12,00 € / PDF - Free
Year of publication: 2024
Reference period: 2022

International Trade Statistics
Annual publication
Price: paper- 6,00 € / PDF - Free
Year of publication: 2021
Reference period: 2020
Quarterly publication
Price: paper- 2,00 € / PDF - Free
Year of publication: 2025
Reference period: 4th Quarter 2024

Annual publication
Price: paper - 4,00 € / PDF - Free
Year of publication: 2024
Reference period: 2023

Agriculture and Fishery Statistics
Annual publication
Price: paper - 3,50 € / PDF - Free
Year of publication: 2024
Reference period: 2023

Annual publication
Price: paper - 12,00 € / PDF - Free
Year of publication: 2021
Reference period: 2019
Construction and Housing Statistics
Annual publication
Price: paper - 4,50 € / PDF - Free
Year of publication: 2024
Reference period: 2023
Annual publication
Price: paper - 3,50 € / PDF - Free
Year of publication: 2024
Reference period: 2023

Annual publication
Price: paper - 22,00 € / PDF - Free
Year of publication: 2023
Reference period: 2022
Monthly publication
Price: paper - 1,50 € / PDF - Free
Year of publication: 2025
Reference period: May 2025
Annual publication
Price: paper - 10,00 € / PDF - Free
Year of publication: 2024
Reference period: 2023
International Trade Statistics
Annual publication
Price: paper - 6,00 € / PDF - Free
Year of publication: 2021
Reference period: 2020
Annual publication
Price: paper - 4,00 € / PDF - Free
Year of publication: 2024
Reference period: 2023
Annual publication
Price: paper - 12,00 € / PDF - Free
Year of publication: 2021
Reference period: 2019
Quarterly Bulletin of Statistics
Quarterly publication
Price: paper - 4,00 € / PDF - Free
Year of publication: 2025
Reference period: 2nd Quarter 2025
Census - Final results. Autonomous Region of Madeira - 2021
Annual publication
Price: paper - 10,00 € / PDF - Free
Year of publication: 2023
Reference period: 2021
Construction and Housing Statistics
Annual publication
Price: paper - 4,50 € / PDF - Free
Year of publication: 2023
Reference period: 2022
Agriculture and Fishery Statistics
Annual publication
Price: paper - 3,50 € / PDF - Free
Year of publication: 2024
Reference period: 2023
Quarterly publication
Price: paper - 2,00 € / PDF - Free
Year of publication: 2025
Reference period: 4th Quarter 2024
Annual publication
Price: paper - 12,00 € / PDF - Free
Year of publication: 2024
Reference period: 2022
Monthly publication
Price: paper - 3,00 € / PDF - Free
Year of publication: 2025
Reference period: December 2024
DREM releases Public Expenditure Statistics for the period 2010-2023
The Regional Directorate of Statistics of Madeira (DREM) releases today a set of information regarding public expenditure by the Regional Administration of Madeira for the period 2010 to 2023, with reference to the 2016 base of the Portuguese National Accounts. It should be noted that for some of the information, the last available year is 2022.
The conceptual framework of public expenditure statistics and the terminology used are based on the European System of Accounts (ESA 2010) and the Manual on Government Finance Statistics (GFSM) for the classification of public expenditure by functions (COFOG). It is important to note that the institutional subsector of the Regional Administration of Madeira (ARM) includes the Regional Government, Autonomous Services, and Funds, which encompass, for example, Public Institutes and Reclassified Companies within the scope of Public Administrations.
Aggregate Public Expenditure - Regional Public Expenditure increased in 2022 but weighed less on GDP
In 2022, the nominal value of public expenditure of the ARM reached 1,708.7 million euros, increasing by 3.9% compared to the previous year. However, given the strong recovery of the Gross Domestic Product (GDP) in 2022, the share of regional public expenditure in GDP decreased to 28.4%, down by 4.3 percentage points (pp) over 2021. Nationally, this ratio was 44.1% in 2022, dropping by 3.4 pp from the previous year. In 2023, for which there is no available regional GDP value, the nominal value of the ARM expenditure was around 1,820.2 million euros, reflecting a growth of 6.5% compared to 2022.
Economic Classification of Expenditure - In 2023, wages grew by 11.7%, while intermediate consumption fell by 4.9%
From the perspective of the economic classification of public expenditure, the three largest components are wages, intermediate consumption, and social benefits, which represented 11.7%, 5.2%, and 4.9% of GDP, respectively, in 2022. In the same order, the share of these items in total expenditure was 41.3%, 18.4%, and 17.3%. In 2023, wages accounted for 43.3% (+2.0 p.p. compared to 2022) and social benefits 17.5% (+0.2 p.p.), surpassing intermediate consumption, which represented 16.4% of total expenditure, or -2.0 p.p. compared to 2022.
In 2022, expenditure on wages reached a total of 705.3 million euros (+3.1% compared to 2021), while in 2023, this item rose to 788.0 million euros (+11.7% compared to 2022).
As for intermediate consumption, it reached 314.8 million euros in 2022, registering an increase of 4.2% compared to the previous year. In 2023, this item fell to 299.4 million euros, -4.9% compared to the previous year.
Meanwhile, social benefits in 2022 grew by 5.1%, reaching 296.4 million euros. In 2023, this item increased to 318.6 million euros, or +7.5% compared to the previous year.
It is also noteworthy that in 2023, property income (mainly corresponding to interest paid) returned to pre-pandemic levels, amounting to 106.1 million euros.
The ARM investment remained relatively stable between 2021 and 2023, going from 157.5 million euros in 2021 to 152.6 million euros in 2022 (-3.1%), then growing again in 2023 to 159.9 million euros (+4.8%).
Other transfers (subsidies, other current transfers, and capital transfers) grew by 22.1% compared to 2021, reaching 219.0 million euros. In 2023, this item decreased by 32.3% to 148.3 million euros, approaching the values recorded in 2019 and 2020.
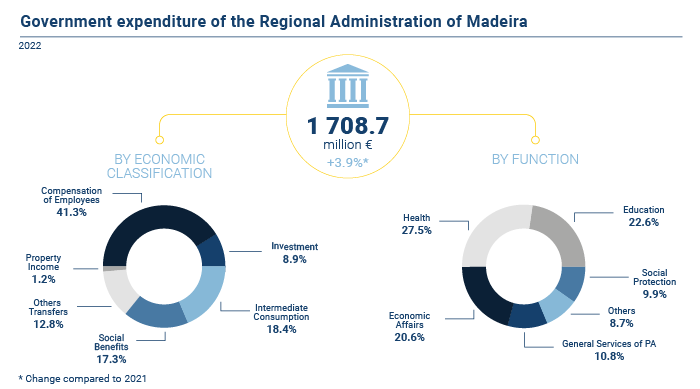
Classification of Expenditure by Functions - Health and Education represented over 50% of total expenditure in 2022
In addition to the economic classification, public expenditure can also be classified by functions (COFOG). The functional classification adopted here follows ESA 2010 guidelines. This classification complements the economic classification, providing information on the purposes of expenditure, thereby broadening the analytical framework for assessing the quality of public expenditure.
In public expenditure, the functions with the largest share of GDP in 2022 were Health (7.8%) and Education (6.4%). Following these were the functions of Economic Affairs; General Public Services (including interest paid), and Social Protection, with shares of GDP of 5.8%, 3.1%, and 2.8%, respectively. In total expenditure, the shares in Health and Education were 27.5% and 22.6%, respectively. Economic Affairs, General Public Services, and Social Protection represented 20.6%, 10.8%, and 9.9% of total expenditure, respectively.
Analysing the expenditure evolution by main functions, between 2021 and 2022, there were increases in Sports, Recreation, Culture, and Religion (+16.2%), Public Order and Safety (+12.8%), Economic Affairs (+7.5%), Environmental Protection (+6.7%), Social Protection (+4.7%), Education (+3.3%), and Health (+3.2%). On the other hand, there were decreases in expenditure for Housing and Community Amenities (-3.6%) and General Public Services (-1.2%).
For more information, please refer to:
 |
|
 |
|

![]()


|
|
|
|
|
|
Copyright © 2026 Direção Regional de Estatística da Madeira. All rights reserved.
Address: Calçada de Santa Clara 38, 9004-545 Funchal, Madeira Island
Phone: +351 291 145 126 (National landline call)
