![]()
![]()

")
")
")
")
")
")
")
")
")
")
Subscribe to our newsletter and get statistical data as soon as it is available!...
|
Resident Population Resident Population Estimates (31 December) adjusted to the final results of the 2021 Census (thousands). |
|
2021 - 2024, Provisional Resident Population Estimates - post-census estimates based on the 2021 Census results. Source: Statistics Portugal/DREM - Demographic Statistics |
|
Unemployment Rate Quarterly rate obtained from the Labour Force Survey, corresponding to the ratio of the unemployed population to the active population (%). |
|
Source: Statistics Portugal/DREM - Labour Force Survey |
|
Inflation Rate Average Rate of Change over the last 12 months of the Consumer Price Index (%). |
|
Source: Statistics Portugal/DREM - Consumer Price Index |
|
Overnight Stays Overnight stays recorded in total collective tourist accommodation (thousands). |
|
Source: Statistics Portugal/DREM - Tourism Statistics |
|
GDP Gross Domestic Product (GDP) of the Autonomous Region of Madeira at current prices, base 2021 (million euros). |
|
The value for 2024 is provisional. Source: Statistics Portugal - Regional Accounts (Base 2021) |
|
Family Dwelling Sales Number of Family Dwelling Sales (Total, New and Existing) in the Autonomous Region of Madeira. |
|
Source: Statistics Portugal (INE, IP.). |
|
Company Incorporation and Dissolution Number of companies incorporated and dissolved. |
|
Source: Directorate-General for Justice Policy |
|
Natural Balance Difference between the number of live births and the number of deaths in a given period of time (No.). |
|
* Preliminary data compiled up to 10th April 2026. Source: Statistics Portugal/DREM - Demographic Statistics |
|
Regional Indicator of Economic Activity 3-month moving average (%). |
|
Source: DREM |
|
Population Resident Population estimates by the 31st of December which incorporate the 2021 Census final results (thousands). |
|
2021 - 2024, Provisional Resident Population Estimates, post-census estimates based on the results of the 2021 Census. Source: INE/DREM - Demographic Statistics |
|
Unemployment Rate Quarterly rate derived from the Labour Fource Survey, which corresponds to the ratio between the unemployed and the active population(%). |
|
Source: INE/DREM - Labour Force Survey |
|
Inflation Rate 12-month average growth rate of the Consumer Price Index. |
|
Source: INE/DREM - Consumer Price Index |
|
Overnight stays Overnight stays in tourism accommodation (thousands). |
|
Source: INE/DREM - Tourism Statistics |
|
GDP Gross Domestic Product (GDP) of the Autonomous Region of Madeira at current prices, base 2021 (millions of euros). |
|
The value for 2024 is provisional. Source: INE - Regional Accounts (Base 2021) |
|
Dwelling Sales Number of Dwelling Sales (Total, New e Existing), in the Autonomous Region of Madeira. |
|
Source: Statistics Portugal |
|
Formation and Dissolution of Companies Number of formed and dissolved companies. |
|
Source: Directorate-General for Justice Policy |
|
Natural Change Balance between the number of live births and the number of deaths in a given time period (No.). |
|
* Preliminary data compiled up until April 10th, 2026. Source: INE/DREM - Demographic Statistics |
|
Regional Indicator of Economic Activity 3-month moving average (%). |
|
Source: DREM |
Annual publication
Price: papel - 3,50 € / PDF - Free
Year of publication: 2024
Reference period: 2023
Quarterly Bulletin of Statistics
Quarterly publication
Price: paper - 4,00 € / PDF - Free
Year of publication: 2025
Reference period: 2nd Quarter 2025
Annual publication
Price: paper - 22,00 € / PDF - Free
Year of publication: 2024
Reference period: 2023

Census - Final results: Autonomous Region of Madeira - 2021
Annual publication
Price: paper - 10,00 € / PDF - Free
Year of publication: 2023
Reference period: 2021
Annual publication
Price: PDF - Free
Year of publication: 2026
Reference period: 2025
Monthly publication
Price: paper - 3,00 € / PDF - Free
Year of publication: 2025
Reference period: December 2024
Annual publication
Price: paper - 10,00 € / PDF - Free
Year of publication: 2024
Reference period: 2023

Annual publication
Price: paper- 12,00 € / PDF - Free
Year of publication: 2024
Reference period: 2022

International Trade Statistics
Annual publication
Price: paper- 6,00 € / PDF - Free
Year of publication: 2021
Reference period: 2020
Quarterly publication
Price: paper- 2,00 € / PDF - Free
Year of publication: 2025
Reference period: 4th Quarter 2024

Annual publication
Price: paper - 4,00 € / PDF - Free
Year of publication: 2024
Reference period: 2023

Agriculture and Fishery Statistics
Annual publication
Price: paper - 3,50 € / PDF - Free
Year of publication: 2024
Reference period: 2023

Annual publication
Price: paper - 12,00 € / PDF - Free
Year of publication: 2021
Reference period: 2019
Construction and Housing Statistics
Annual publication
Price: paper - 4,50 € / PDF - Free
Year of publication: 2024
Reference period: 2023
Annual publication
Price: paper - 3,50 € / PDF - Free
Year of publication: 2024
Reference period: 2023

Annual publication
Price: paper - 22,00 € / PDF - Free
Year of publication: 2023
Reference period: 2022
Monthly publication
Price: paper - 1,50 € / PDF - Free
Year of publication: 2025
Reference period: May 2025
Annual publication
Price: paper - 10,00 € / PDF - Free
Year of publication: 2024
Reference period: 2023
International Trade Statistics
Annual publication
Price: paper - 6,00 € / PDF - Free
Year of publication: 2021
Reference period: 2020
Annual publication
Price: paper - 4,00 € / PDF - Free
Year of publication: 2024
Reference period: 2023
Annual publication
Price: paper - 12,00 € / PDF - Free
Year of publication: 2021
Reference period: 2019
Quarterly Bulletin of Statistics
Quarterly publication
Price: paper - 4,00 € / PDF - Free
Year of publication: 2025
Reference period: 2nd Quarter 2025
Census - Final results. Autonomous Region of Madeira - 2021
Annual publication
Price: paper - 10,00 € / PDF - Free
Year of publication: 2023
Reference period: 2021
Construction and Housing Statistics
Annual publication
Price: paper - 4,50 € / PDF - Free
Year of publication: 2023
Reference period: 2022
Agriculture and Fishery Statistics
Annual publication
Price: paper - 3,50 € / PDF - Free
Year of publication: 2024
Reference period: 2023
Quarterly publication
Price: paper - 2,00 € / PDF - Free
Year of publication: 2025
Reference period: 4th Quarter 2024
Annual publication
Price: paper - 12,00 € / PDF - Free
Year of publication: 2024
Reference period: 2022
Monthly publication
Price: paper - 3,00 € / PDF - Free
Year of publication: 2025
Reference period: December 2024
For the period 2010–2024
DREM releases Public Expenditure Statistics
The Regional Directorate of Statistics of Madeira (DREM) releases today a set of information on the public expenditure of the Regional Administration of Madeira for the period 2010 to 2024, with reference to the 2021 benchmark of the Portuguese National Accounts. However, in this analysis of results, only the years between 2017 and 2024 will be taken into account, with 2024 being the last year available for some of the information.
The conceptual framework of public expenditure statistics and the terminology adopted are underpinned by the European System of Accounts (ESA 2010) and the Manual on sources and methods for the compilation of statistics on the Classification of the Functions of Government (COFOG).
It should be noted that the institutional sub-sector of the Regional Administration of Madeira (RAM) comprises the Regional Government, Autonomous Services and Funds (which include, for example, Public Institutes) and Enterprises reclassified within the scope of Public Administrations.
Aggregate public expenditure – Share of public expenditure of the Regional Administration of Madeira in GDP increased in 2024, in line with the State
In 2024, the nominal value of public expenditure of the RAM reached 1 972.4 million euros, having increased by 9.1% compared to the previous year, representing +163.8 million euros. In turn, the nominal increase in Gross Domestic Product (GDP) in 2024 was 7.5%, so the share of regional public expenditure in GDP rose from 26.0% in 2023 to 26.3% in 2024. Nationally, in 2024, this ratio stood at 42.4%, having increased by 0.4 percentage points (pp) compared to the preceding year.
Economic classification of expenditure – In 2024, investment increased by 29.7%, whilst wages grew by 7.2%
From the perspective of the economic classification of public expenditure, the three largest components are wages, social benefits and intermediate consumption, which accounted for 11.3%, 4.6% and 4.2% of GDP, respectively, in 2024. In that year, as a share of total expenditure, wages accounted for 42.9% (-0.7 pp than in 2023), followed by social benefits at 17.5% (-0.1 pp than in the preceding year) and intermediate consumption, which represented 15.8% of total expenditure, i.e. -1.1 pp than in 2023.
In 2023, expenditure on wages reached a total of 788.9 million euros (+11.3% compared to 2022), whilst in 2024, this item rose to 845.8 million euros (+7.2% compared to 2023).
As regards intermediate consumption, it reached 307.1 million euros in 2023, recording an increase of 16.0% compared to the previous year. In 2024, this item rose slightly to 312.5 million euros, +1.8% compared to the preceding year.
In turn, social benefits grew by 4.9% in 2023, to 317.5 million euros. In 2024, this item increased to 344.3 million euros, i.e. +8.5% compared to the previous year.
It should also be noted that, in 2024, property income (corresponding mainly to interest paid) stood at 98.1 million euros (+3.2% compared to the preceding year).
Investment expenditure of the RAM grew between 2022 and 2024, rising from 153.2 million euros in 2022 to 158.3 million euros in 2023 (+3.4%), and increasing again in 2024 to 205.4 million euros (+29.7%).
Other transfers (subsidies; other current transfers and capital transfers) decreased by 31.1% between 2022 and 2023, not exceeding 141.8 million euros in that year. In 2024, this item advanced by 17.3%, standing at 166.3 million euros.
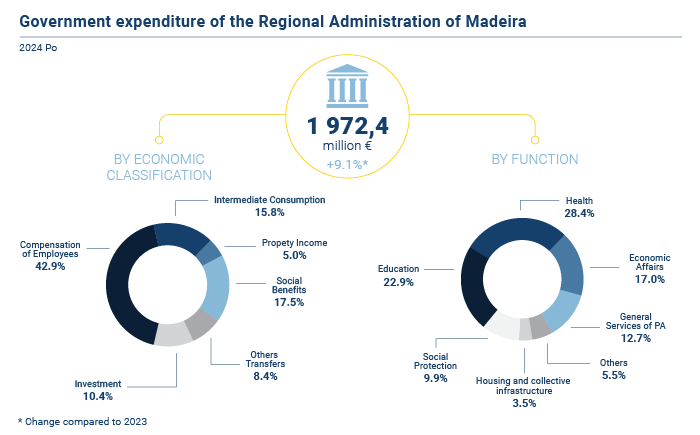
Classification of expenditure by function – Health and Education together accounted for 51.3% of total expenditure in 2024
In addition to the economic classification, public expenditure can also be classified by function (COFOG), which is described in the methodological note at the end of this document. The functional classification adopted here is that recommended by ESA 2010. This classification complements the economic classification by providing information on the purposes of expenditure, thus broadening the analytical framework for assessing the quality of public expenditure.
In public expenditure, the functions with the greatest weight in GDP in 2024 were Health (7.5%) and Education (6.0%). These are followed by Economic affairs, General public services (which include interest paid) and Social protection, with shares in GDP of 4.5%, 3.4% and 2.6%, respectively. As a share of total expenditure, Health and Education accounted for 28.4% and 22.9%, respectively. Economic affairs, General public services and Social protection represented 17.0%, 12.7% and 9.9% of total expenditure, respectively.
Analysing the changes in expenditure by main function between 2023 and 2024, increases were recorded in Recreation, culture and religion (+25.7%), Environmental protection (+20.7%), Economic affairs (+14.0%), Public order and safety (+10.8%), Social protection (+10.2%), Health (+9.6%), Education (+6.6%) and General public services (+5.5%).
Para mais informação aceda a:
 |
|
 |
|


![]()


|
|
|
|
|
|
Copyright © 2026 Direção Regional de Estatística da Madeira. All rights reserved.
Address: Calçada de Santa Clara 38, 9004-545 Funchal, Madeira Island
Phone: +351 291 145 126 (National landline call)
