![]()
![]()

")
")
")
")
")
")
")
")
")
")
Subscribe to our newsletter and get statistical data as soon as it is available!...
|
Resident Population Resident Population Estimates (31 December) adjusted to the final results of the 2021 Census (thousands). |
|
2021 - 2024, Provisional Resident Population Estimates - post-census estimates based on the 2021 Census results. Source: Statistics Portugal/DREM - Demographic Statistics |
|
Unemployment Rate Quarterly rate obtained from the Labour Force Survey, corresponding to the ratio of the unemployed population to the active population (%). |
|
Source: Statistics Portugal/DREM - Labour Force Survey |
|
Inflation Rate Average Rate of Change over the last 12 months of the Consumer Price Index (%). |
|
Source: Statistics Portugal/DREM - Consumer Price Index |
|
Overnight Stays Overnight stays recorded in total collective tourist accommodation (thousands). |
|
Source: Statistics Portugal/DREM - Tourism Statistics |
|
GDP Gross Domestic Product (GDP) of the Autonomous Region of Madeira at current prices, base 2021 (million euros). |
|
The value for 2024 is provisional. Source: Statistics Portugal - Regional Accounts (Base 2021) |
|
Family Dwelling Sales Number of Family Dwelling Sales (Total, New and Existing) in the Autonomous Region of Madeira. |
|
Source: Statistics Portugal (INE, IP.). |
|
Company Incorporation and Dissolution Number of companies incorporated and dissolved. |
|
Source: Directorate-General for Justice Policy |
|
Natural Balance Difference between the number of live births and the number of deaths in a given period of time (No.). |
|
* Preliminary data compiled up to 10th April 2026. Source: Statistics Portugal/DREM - Demographic Statistics |
|
Regional Indicator of Economic Activity 3-month moving average (%). |
|
Source: DREM |
|
Population Resident Population estimates by the 31st of December which incorporate the 2021 Census final results (thousands). |
|
2021 - 2024, Provisional Resident Population Estimates, post-census estimates based on the results of the 2021 Census. Source: INE/DREM - Demographic Statistics |
|
Unemployment Rate Quarterly rate derived from the Labour Fource Survey, which corresponds to the ratio between the unemployed and the active population(%). |
|
Source: INE/DREM - Labour Force Survey |
|
Inflation Rate 12-month average growth rate of the Consumer Price Index. |
|
Source: INE/DREM - Consumer Price Index |
|
Overnight stays Overnight stays in tourism accommodation (thousands). |
|
Source: INE/DREM - Tourism Statistics |
|
GDP Gross Domestic Product (GDP) of the Autonomous Region of Madeira at current prices, base 2021 (millions of euros). |
|
The value for 2024 is provisional. Source: INE - Regional Accounts (Base 2021) |
|
Dwelling Sales Number of Dwelling Sales (Total, New e Existing), in the Autonomous Region of Madeira. |
|
Source: Statistics Portugal |
|
Formation and Dissolution of Companies Number of formed and dissolved companies. |
|
Source: Directorate-General for Justice Policy |
|
Natural Change Balance between the number of live births and the number of deaths in a given time period (No.). |
|
* Preliminary data compiled up until April 10th, 2026. Source: INE/DREM - Demographic Statistics |
|
Regional Indicator of Economic Activity 3-month moving average (%). |
|
Source: DREM |
Annual publication
Price: papel - 3,50 € / PDF - Free
Year of publication: 2024
Reference period: 2023
Quarterly Bulletin of Statistics
Quarterly publication
Price: paper - 4,00 € / PDF - Free
Year of publication: 2025
Reference period: 2nd Quarter 2025
Annual publication
Price: paper - 22,00 € / PDF - Free
Year of publication: 2024
Reference period: 2023

Census - Final results: Autonomous Region of Madeira - 2021
Annual publication
Price: paper - 10,00 € / PDF - Free
Year of publication: 2023
Reference period: 2021
Annual publication
Price: PDF - Free
Year of publication: 2026
Reference period: 2025
Monthly publication
Price: paper - 3,00 € / PDF - Free
Year of publication: 2025
Reference period: December 2024
Annual publication
Price: paper - 10,00 € / PDF - Free
Year of publication: 2024
Reference period: 2023

Annual publication
Price: paper- 12,00 € / PDF - Free
Year of publication: 2024
Reference period: 2022

International Trade Statistics
Annual publication
Price: paper- 6,00 € / PDF - Free
Year of publication: 2021
Reference period: 2020
Quarterly publication
Price: paper- 2,00 € / PDF - Free
Year of publication: 2025
Reference period: 4th Quarter 2024

Annual publication
Price: paper - 4,00 € / PDF - Free
Year of publication: 2024
Reference period: 2023

Agriculture and Fishery Statistics
Annual publication
Price: paper - 3,50 € / PDF - Free
Year of publication: 2024
Reference period: 2023

Annual publication
Price: paper - 12,00 € / PDF - Free
Year of publication: 2021
Reference period: 2019
Construction and Housing Statistics
Annual publication
Price: paper - 4,50 € / PDF - Free
Year of publication: 2024
Reference period: 2023
Annual publication
Price: paper - 3,50 € / PDF - Free
Year of publication: 2024
Reference period: 2023

Annual publication
Price: paper - 22,00 € / PDF - Free
Year of publication: 2023
Reference period: 2022
Monthly publication
Price: paper - 1,50 € / PDF - Free
Year of publication: 2025
Reference period: May 2025
Annual publication
Price: paper - 10,00 € / PDF - Free
Year of publication: 2024
Reference period: 2023
International Trade Statistics
Annual publication
Price: paper - 6,00 € / PDF - Free
Year of publication: 2021
Reference period: 2020
Annual publication
Price: paper - 4,00 € / PDF - Free
Year of publication: 2024
Reference period: 2023
Annual publication
Price: paper - 12,00 € / PDF - Free
Year of publication: 2021
Reference period: 2019
Quarterly Bulletin of Statistics
Quarterly publication
Price: paper - 4,00 € / PDF - Free
Year of publication: 2025
Reference period: 2nd Quarter 2025
Census - Final results. Autonomous Region of Madeira - 2021
Annual publication
Price: paper - 10,00 € / PDF - Free
Year of publication: 2023
Reference period: 2021
Construction and Housing Statistics
Annual publication
Price: paper - 4,50 € / PDF - Free
Year of publication: 2023
Reference period: 2022
Agriculture and Fishery Statistics
Annual publication
Price: paper - 3,50 € / PDF - Free
Year of publication: 2024
Reference period: 2023
Quarterly publication
Price: paper - 2,00 € / PDF - Free
Year of publication: 2025
Reference period: 4th Quarter 2024
Annual publication
Price: paper - 12,00 € / PDF - Free
Year of publication: 2024
Reference period: 2022
Monthly publication
Price: paper - 3,00 € / PDF - Free
Year of publication: 2025
Reference period: December 2024
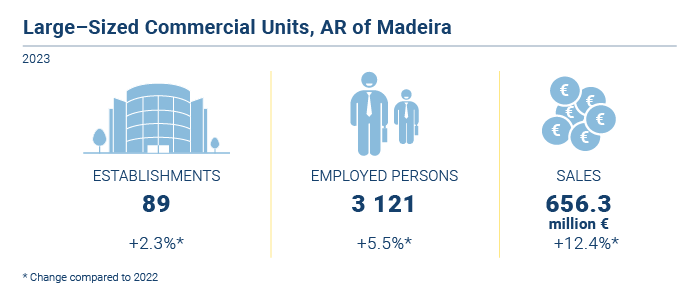
In 2023
Sales of Large-sized Commercial Units (LSCU) increased by 12.4% compared to the previous year, while employment grew by 5.5%
The Regional Directorate of Statistics of Madeira (DREM) has released information regarding the Large-sized Commercial Units (LSCU) for 2023, published today by Statistics Portugal (INE). The LSCU is an establishment, considered either individually or as part of a group belonging to the same company or corporate group, engaged in commercial activities and which has a noteworthy exhibition and sales area (see specific conditions in the "Em Foco" section).
In 2023, there were 89 Large-sized Commercial Units (LSCU) in the ARM (2 more than in 2022), with 66.3% dedicated to non-food retail and 33.7% focused on food retail or predominantly food-related. It is worth noting that a significant proportion of these establishments (80.6%) belong to companies headquartered in mainland Portugal.
In that year, the LSCUs in the ARM employed 3,121 workers (+5.5% compared to the previous year), 68.2% of whom were women, with 22.5% employed on a temporary basis. These units generated a turnover of 659.3 million euros in 2023 (+12.4% compared to 2022), of which 656.3 million euros corresponded to sales revenue.
The food retail sector, with 30 establishments, generated 454.6 million euros in sales (up from 396.1 million euros in 2022), while the 59 non-food retail establishments reported 201.7 million euros in sales (up from 187.8 million euros the previous year).
On average, each food retail establishment achieved annual sales of 15.2 million euros, while non-food retail establishments averaged around 3.4 million euros in sales.
Food retail units employed 2,069 workers (+3.0% compared to the previous year), 69.1% of whom were women, with 18.2% employed on a temporary basis. Non-food retail units employed 1,052 workers (+10.6% compared to the previous year), 66.6% of whom were women, with 30.9% employed temporarily.
In 2023, the exhibition and sales area in food retail reached 38.1 thousand per square meter, while non-food retail establishments accounted for 49.1 thousand square meter.
The number of transactions conducted at LSCU establishments reached 27.2 million. In food retail, the average transaction value was 20.6 euros (compared to 19.0 euros in 2022), while in non-food retail, it was 39.7 euros (up from 36.3 euros in 2022).
In food retail units, food products, beverages, and tobacco accounted for 82.0% of total sales (+1.3 percentage points compared to 2022). The main products sold in this class were "other food products n.e.c." (16.1%), "meat and meat-based products" (15.4%), and "fruits and vegetables" (12.3%). Among non-food products (18.0% of total sales), the most sold items were "cosmetics and personal hygiene" (7.5%), "other sales and products" (4.1%), and "household cleaning products" (3.4%).
In non-food retail establishments, the most significant sales were in "clothing and accessories" (27.6%), "household appliances" (13.4%), "computers and optical, photographic, and telecommunications equipment" (12.5%), and "furniture and decorative items" (9.9%).
In 2023, the sale of private label products amounted to 249.7 million euros in LSCU establishments (+15.9% compared to 2022), representing 36.1% of the food retail sales volume and 42.6% of the non-food retail sales volume (up from 34.4% and 42.3% respectively in 2022).
Regarding payment methods, debit and credit cards were used in 67.8% of food retail sales (up from 59.4% in 2022) and 73.8% of non-food retail sales (up from 68.3% in 2022). Cash payments represented 28.7% of food retail sales (down from 29.8% in 2022) and 22.6% of non-food retail sales (down from 23.0% in 2022).
For more information, please visit:
 |
|
 |
|

![]()


|
|
|
|
|
|
Copyright © 2026 Direção Regional de Estatística da Madeira. All rights reserved.
Address: Calçada de Santa Clara 38, 9004-545 Funchal, Madeira Island
Phone: +351 291 145 126 (National landline call)
