![]()
![]()

")
")
")
")
")
")
")
")
")
")
Subscribe to our newsletter and get statistical data as soon as it is available!...
|
Resident Population Resident Population Estimates (31 December) adjusted to the final results of the 2021 Census (thousands). |
|
2021 - 2024, Provisional Resident Population Estimates - post-census estimates based on the 2021 Census results. Source: Statistics Portugal/DREM - Demographic Statistics |
|
Unemployment Rate Quarterly rate obtained from the Labour Force Survey, corresponding to the ratio of the unemployed population to the active population (%). |
|
Source: Statistics Portugal/DREM - Labour Force Survey |
|
Inflation Rate Average Rate of Change over the last 12 months of the Consumer Price Index (%). |
|
Source: Statistics Portugal/DREM - Consumer Price Index |
|
Overnight Stays Overnight stays recorded in total collective tourist accommodation (thousands). |
|
Source: Statistics Portugal/DREM - Tourism Statistics |
|
GDP Gross Domestic Product (GDP) of the Autonomous Region of Madeira at current prices, base 2021 (million euros). |
|
The value for 2024 is provisional. Source: Statistics Portugal - Regional Accounts (Base 2021) |
|
Family Dwelling Sales Number of Family Dwelling Sales (Total, New and Existing) in the Autonomous Region of Madeira. |
|
Source: Statistics Portugal (INE, IP.). |
|
Company Incorporation and Dissolution Number of companies incorporated and dissolved. |
|
Source: Directorate-General for Justice Policy |
|
Natural Balance Difference between the number of live births and the number of deaths in a given period of time (No.). |
|
* Preliminary data compiled up to 10th April 2026. Source: Statistics Portugal/DREM - Demographic Statistics |
|
Regional Indicator of Economic Activity 3-month moving average (%). |
|
Source: DREM |
|
Population Resident Population estimates by the 31st of December which incorporate the 2021 Census final results (thousands). |
|
2021 - 2024, Provisional Resident Population Estimates, post-census estimates based on the results of the 2021 Census. Source: INE/DREM - Demographic Statistics |
|
Unemployment Rate Quarterly rate derived from the Labour Fource Survey, which corresponds to the ratio between the unemployed and the active population(%). |
|
Source: INE/DREM - Labour Force Survey |
|
Inflation Rate 12-month average growth rate of the Consumer Price Index. |
|
Source: INE/DREM - Consumer Price Index |
|
Overnight stays Overnight stays in tourism accommodation (thousands). |
|
Source: INE/DREM - Tourism Statistics |
|
GDP Gross Domestic Product (GDP) of the Autonomous Region of Madeira at current prices, base 2021 (millions of euros). |
|
The value for 2024 is provisional. Source: INE - Regional Accounts (Base 2021) |
|
Dwelling Sales Number of Dwelling Sales (Total, New e Existing), in the Autonomous Region of Madeira. |
|
Source: Statistics Portugal |
|
Formation and Dissolution of Companies Number of formed and dissolved companies. |
|
Source: Directorate-General for Justice Policy |
|
Natural Change Balance between the number of live births and the number of deaths in a given time period (No.). |
|
* Preliminary data compiled up until April 10th, 2026. Source: INE/DREM - Demographic Statistics |
|
Regional Indicator of Economic Activity 3-month moving average (%). |
|
Source: DREM |
Annual publication
Price: papel - 3,50 € / PDF - Free
Year of publication: 2024
Reference period: 2023
Quarterly Bulletin of Statistics
Quarterly publication
Price: paper - 4,00 € / PDF - Free
Year of publication: 2025
Reference period: 2nd Quarter 2025
Annual publication
Price: paper - 22,00 € / PDF - Free
Year of publication: 2024
Reference period: 2023

Census - Final results: Autonomous Region of Madeira - 2021
Annual publication
Price: paper - 10,00 € / PDF - Free
Year of publication: 2023
Reference period: 2021
Annual publication
Price: PDF - Free
Year of publication: 2026
Reference period: 2025
Monthly publication
Price: paper - 3,00 € / PDF - Free
Year of publication: 2025
Reference period: December 2024
Annual publication
Price: paper - 10,00 € / PDF - Free
Year of publication: 2024
Reference period: 2023

Annual publication
Price: paper- 12,00 € / PDF - Free
Year of publication: 2024
Reference period: 2022

International Trade Statistics
Annual publication
Price: paper- 6,00 € / PDF - Free
Year of publication: 2021
Reference period: 2020
Quarterly publication
Price: paper- 2,00 € / PDF - Free
Year of publication: 2025
Reference period: 4th Quarter 2024

Annual publication
Price: paper - 4,00 € / PDF - Free
Year of publication: 2024
Reference period: 2023

Agriculture and Fishery Statistics
Annual publication
Price: paper - 3,50 € / PDF - Free
Year of publication: 2024
Reference period: 2023

Annual publication
Price: paper - 12,00 € / PDF - Free
Year of publication: 2021
Reference period: 2019
Construction and Housing Statistics
Annual publication
Price: paper - 4,50 € / PDF - Free
Year of publication: 2024
Reference period: 2023
Annual publication
Price: paper - 3,50 € / PDF - Free
Year of publication: 2024
Reference period: 2023

Annual publication
Price: paper - 22,00 € / PDF - Free
Year of publication: 2023
Reference period: 2022
Monthly publication
Price: paper - 1,50 € / PDF - Free
Year of publication: 2025
Reference period: May 2025
Annual publication
Price: paper - 10,00 € / PDF - Free
Year of publication: 2024
Reference period: 2023
International Trade Statistics
Annual publication
Price: paper - 6,00 € / PDF - Free
Year of publication: 2021
Reference period: 2020
Annual publication
Price: paper - 4,00 € / PDF - Free
Year of publication: 2024
Reference period: 2023
Annual publication
Price: paper - 12,00 € / PDF - Free
Year of publication: 2021
Reference period: 2019
Quarterly Bulletin of Statistics
Quarterly publication
Price: paper - 4,00 € / PDF - Free
Year of publication: 2025
Reference period: 2nd Quarter 2025
Census - Final results. Autonomous Region of Madeira - 2021
Annual publication
Price: paper - 10,00 € / PDF - Free
Year of publication: 2023
Reference period: 2021
Construction and Housing Statistics
Annual publication
Price: paper - 4,50 € / PDF - Free
Year of publication: 2023
Reference period: 2022
Agriculture and Fishery Statistics
Annual publication
Price: paper - 3,50 € / PDF - Free
Year of publication: 2024
Reference period: 2023
Quarterly publication
Price: paper - 2,00 € / PDF - Free
Year of publication: 2025
Reference period: 4th Quarter 2024
Annual publication
Price: paper - 12,00 € / PDF - Free
Year of publication: 2024
Reference period: 2022
Monthly publication
Price: paper - 3,00 € / PDF - Free
Year of publication: 2025
Reference period: December 2024
In September 2025
Regional economy remained on a growth path, with a slight acceleration
The regional economic activity remained on a positive growth trajectory, showing a slight acceleration.
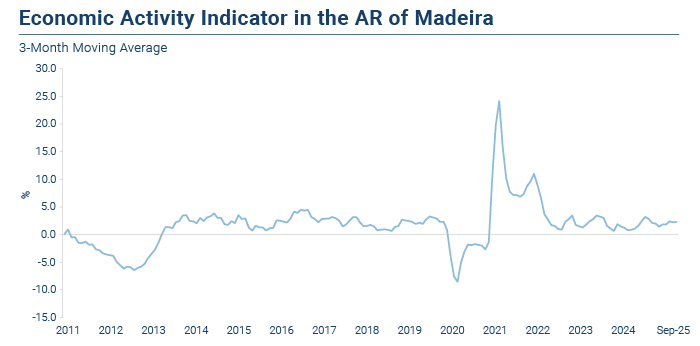
Since the first release of the RIEA in October 2017, DREM has highlighted that its objective is “to signal the behaviour of economic activity, namely with regard to its direction and the magnitude of fluctuations: whether the economy is in positive or negative territory, the presence of accelerations or decelerations, and the identification of turning points”. Its quantitative value, therefore, assumes a secondary importance and should not be regarded as a substitute for the actual change of Gross Domestic Product, which is determined using a broader and more comprehensive set of statistical information, notwithstanding the strong correlation between the two variables.
Economic Activity
As previously noted, in September 2025, the Regional Indicator of Economic Activity (RIEA) shows that the Region’s economic activity maintained its growth trajectory, recording a further acceleration compared with the previous month.
The number of overnight stays in tourist accommodation establishments increased by 4.7%, below the 5.2% observed in August. Total revenue grew by 18.7%, also slightly below the 19.0% recorded in the previous month, while RevPAR slowed to 16.7% (from 16.8% in August).
Electricity generation recorded a positive change of 1.1%, above the 0.8% registered in the preceding month. In contrast, the introduction of diesel for consumption declined by 0.4%, following a growth of 1.0% observed in August.
Meanwhile, the ratio of company incorporations to dissolutions increased to 3.2 new companies per dissolution, above the ratio of 2.7 registered in the previous month.
Qualitative Indicators
In September 2025, the confidence indicators showed mixed developments across the sectors analysed. Improvements were observed in manufacturing and in construction and public works, whereas the trade and services sectors registered declines in their confidence levels compared with the previous month.
Private Consumption
In September 2025, the gasoline released for consumption maintained its upward trajectory, posting a year-on-year increase of 10.8%, very close to the 10.9% recorded in August.
The balance of loans for consumption and other purposes granted to households and non-profit institutions serving households rose by 8.6%, slightly above the 8.4% growth recorded in the previous month, thus extending the positive trend of recent months.
Withdrawals and purchases made through automated payment terminals using national cards increased by 8.2%, slowing from 8.8% in August but still remaining on a solid growth path.
Finally, sales of passenger cars recorded a very sharp decline (–33.9%), deepening the downturn that began in July.
Investment
In September 2025, investment indicators showed distinct behaviours. Sales of light commercial vehicles reversed the negative trend observed in previous months, increasing by 7.2% after a significant decline of –17.1% recorded in August.
In the same month, the balance of loans granted to non-financial corporations returned to growth, remained unchanged year-on-year (zero change), following a slight decrease of 0.1% in August.
Cement sales returned to positive territory, increasing 1.1% year-on-year after the –3.3% drop recorded in the previous month.
The median value of bank appraisals for housing maintained a strong upward trajectory, accelerating to 17.4%, above the 16.7% observed in August.
Regarding the number of building permits, a 31.0% increase was recorded, slowing from the very pronounced growth registered in August (48.9%), yet remaining at high levels.
External Demand
In September 2025, regional goods exports increased by 53.6%, remaining at very high levels (54.0% in August). Conversely, goods imports continued to decline, albeit at a lower rate, registering a negative change of 1.0%, following a decrease of 7.2% in the previous month.
The movement of goods through the Region’s ports showed moderate changes, shifting from –1.1% in August to 0.1% in September. Passenger traffic at regional airports maintained a very dynamic growth pace, increasing by 15.7%, a value close to the 16.1% recorded in the previous month.
Furthermore, withdrawals and purchases through TPA using international cards rose by 7.4%, continuing the deceleration observed in recent months, in line with the slowdown that began in July.
Labour Market
In September 2025, the registered unemployed fell by 12.3%, accelerating compared with the reduction observed in August (–11.4%), although remaining below the sharper declines recorded in July and June.
Job applications continued to decline, registering –12.0%, after the –10.6% drop observed in the previous month, thereby maintaining the downward trend, now with a slight intensification.
In contrast, job offers decreased by 1.0% in September, reversing the growth trend recorded in August (11.1%).
Prices
In September 2025, the year-on-year rate of change of the Consumer Price Index (CPI) stood at 3.0%, slightly below the 3.3% recorded in August.
Inflation in goods slowed to 2.2%, after 2.6% in the previous month, while the year-on-year rate for services increased to 4.0%, above the 3.8% observed in August.
Finally, the underlying inflation indicator decreased to 2.4%, following 2.5% in the previous month.
For more information, visit:
 |
|
 |
|

![]()


|
|
|
|
|
|
Copyright © 2026 Direção Regional de Estatística da Madeira. All rights reserved.
Address: Calçada de Santa Clara 38, 9004-545 Funchal, Madeira Island
Phone: +351 291 145 126 (National landline call)
