![]()
![]()

")
")
")
")
")
")
")
")
")
")
Subscribe to our newsletter and get statistical data as soon as it is available!...
|
Resident Population Resident Population Estimates (31 December) adjusted to the final results of the 2021 Census (thousands). |
|
2021 - 2024, Provisional Resident Population Estimates - post-census estimates based on the 2021 Census results. Source: Statistics Portugal/DREM - Demographic Statistics |
|
Unemployment Rate Quarterly rate obtained from the Labour Force Survey, corresponding to the ratio of the unemployed population to the active population (%). |
|
Source: Statistics Portugal/DREM - Labour Force Survey |
|
Inflation Rate Average Rate of Change over the last 12 months of the Consumer Price Index (%). |
|
Source: Statistics Portugal/DREM - Consumer Price Index |
|
Overnight Stays Overnight stays recorded in total collective tourist accommodation (thousands). |
|
Source: Statistics Portugal/DREM - Tourism Statistics |
|
GDP Gross Domestic Product (GDP) of the Autonomous Region of Madeira at current prices, base 2021 (million euros). |
|
The value for 2024 is provisional. Source: Statistics Portugal - Regional Accounts (Base 2021) |
|
Family Dwelling Sales Number of Family Dwelling Sales (Total, New and Existing) in the Autonomous Region of Madeira. |
|
Source: Statistics Portugal (INE, IP.). |
|
Company Incorporation and Dissolution Number of companies incorporated and dissolved. |
|
Source: Directorate-General for Justice Policy |
|
Natural Balance Difference between the number of live births and the number of deaths in a given period of time (No.). |
|
* Preliminary data compiled up to 10th April 2026. Source: Statistics Portugal/DREM - Demographic Statistics |
|
Regional Indicator of Economic Activity 3-month moving average (%). |
|
Source: DREM |
|
Population Resident Population estimates by the 31st of December which incorporate the 2021 Census final results (thousands). |
|
2021 - 2024, Provisional Resident Population Estimates, post-census estimates based on the results of the 2021 Census. Source: INE/DREM - Demographic Statistics |
|
Unemployment Rate Quarterly rate derived from the Labour Fource Survey, which corresponds to the ratio between the unemployed and the active population(%). |
|
Source: INE/DREM - Labour Force Survey |
|
Inflation Rate 12-month average growth rate of the Consumer Price Index. |
|
Source: INE/DREM - Consumer Price Index |
|
Overnight stays Overnight stays in tourism accommodation (thousands). |
|
Source: INE/DREM - Tourism Statistics |
|
GDP Gross Domestic Product (GDP) of the Autonomous Region of Madeira at current prices, base 2021 (millions of euros). |
|
The value for 2024 is provisional. Source: INE - Regional Accounts (Base 2021) |
|
Dwelling Sales Number of Dwelling Sales (Total, New e Existing), in the Autonomous Region of Madeira. |
|
Source: Statistics Portugal |
|
Formation and Dissolution of Companies Number of formed and dissolved companies. |
|
Source: Directorate-General for Justice Policy |
|
Natural Change Balance between the number of live births and the number of deaths in a given time period (No.). |
|
* Preliminary data compiled up until April 10th, 2026. Source: INE/DREM - Demographic Statistics |
|
Regional Indicator of Economic Activity 3-month moving average (%). |
|
Source: DREM |
Annual publication
Price: papel - 3,50 € / PDF - Free
Year of publication: 2024
Reference period: 2023
Quarterly Bulletin of Statistics
Quarterly publication
Price: paper - 4,00 € / PDF - Free
Year of publication: 2025
Reference period: 2nd Quarter 2025
Annual publication
Price: paper - 22,00 € / PDF - Free
Year of publication: 2024
Reference period: 2023

Census - Final results: Autonomous Region of Madeira - 2021
Annual publication
Price: paper - 10,00 € / PDF - Free
Year of publication: 2023
Reference period: 2021
Annual publication
Price: PDF - Free
Year of publication: 2026
Reference period: 2025
Monthly publication
Price: paper - 3,00 € / PDF - Free
Year of publication: 2025
Reference period: December 2024
Annual publication
Price: paper - 10,00 € / PDF - Free
Year of publication: 2024
Reference period: 2023

Annual publication
Price: paper- 12,00 € / PDF - Free
Year of publication: 2024
Reference period: 2022

International Trade Statistics
Annual publication
Price: paper- 6,00 € / PDF - Free
Year of publication: 2021
Reference period: 2020
Quarterly publication
Price: paper- 2,00 € / PDF - Free
Year of publication: 2025
Reference period: 4th Quarter 2024

Annual publication
Price: paper - 4,00 € / PDF - Free
Year of publication: 2024
Reference period: 2023

Agriculture and Fishery Statistics
Annual publication
Price: paper - 3,50 € / PDF - Free
Year of publication: 2024
Reference period: 2023

Annual publication
Price: paper - 12,00 € / PDF - Free
Year of publication: 2021
Reference period: 2019
Construction and Housing Statistics
Annual publication
Price: paper - 4,50 € / PDF - Free
Year of publication: 2024
Reference period: 2023
Annual publication
Price: paper - 3,50 € / PDF - Free
Year of publication: 2024
Reference period: 2023

Annual publication
Price: paper - 22,00 € / PDF - Free
Year of publication: 2023
Reference period: 2022
Monthly publication
Price: paper - 1,50 € / PDF - Free
Year of publication: 2025
Reference period: May 2025
Annual publication
Price: paper - 10,00 € / PDF - Free
Year of publication: 2024
Reference period: 2023
International Trade Statistics
Annual publication
Price: paper - 6,00 € / PDF - Free
Year of publication: 2021
Reference period: 2020
Annual publication
Price: paper - 4,00 € / PDF - Free
Year of publication: 2024
Reference period: 2023
Annual publication
Price: paper - 12,00 € / PDF - Free
Year of publication: 2021
Reference period: 2019
Quarterly Bulletin of Statistics
Quarterly publication
Price: paper - 4,00 € / PDF - Free
Year of publication: 2025
Reference period: 2nd Quarter 2025
Census - Final results. Autonomous Region of Madeira - 2021
Annual publication
Price: paper - 10,00 € / PDF - Free
Year of publication: 2023
Reference period: 2021
Construction and Housing Statistics
Annual publication
Price: paper - 4,50 € / PDF - Free
Year of publication: 2023
Reference period: 2022
Agriculture and Fishery Statistics
Annual publication
Price: paper - 3,50 € / PDF - Free
Year of publication: 2024
Reference period: 2023
Quarterly publication
Price: paper - 2,00 € / PDF - Free
Year of publication: 2025
Reference period: 4th Quarter 2024
Annual publication
Price: paper - 12,00 € / PDF - Free
Year of publication: 2024
Reference period: 2022
Monthly publication
Price: paper - 3,00 € / PDF - Free
Year of publication: 2025
Reference period: December 2024
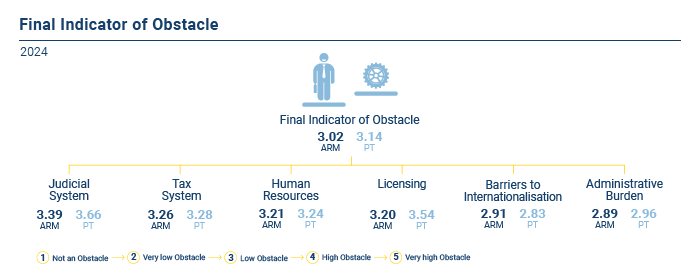
In 2024
The judicial system was once again perceived as the main obstacle to the conduct of business activity
The Regional Directorate of Statistics of Madeira (DREM) is today releasing, for the second time, the results for the Autonomous Region of Madeira (ARM) of the Survey on Framework Regulation Costs (Inquérito aos Custos de Contexto – IaCC).
The framework regulation costs may be defined as the negative effects arising from rules, procedures, actions and/or omissions that hinder business activity and are not attributable to the investor, the business itself, or its organisational structure.
The IaCC – referring to the year 2024 – covered nine domains identified as potential areas of constraint on the activity of non-financial enterprises: business start-up, licensing procedures, network industries, financing, judicial system, tax system, administrative burden, barriers to internationalisation and human resources.
In 2024, the global framework regulation costs indicator for the Autonomous Region of Madeira recorded an intermediate value of 3.02 points (+0.07 compared with 2021) on a scale from 1 to 5, below the 3.14 observed for the country as a whole (3.09 in 2021).
Among the nine domains analysed, the judicial system (3.39), the tax system (3.26) and human resources (3.21) were identified by enterprises as the main obstacles. Licensing procedures and barriers to internationalisation also stand out, with indicators of 3.20 and 2.91, respectively.
Financing was the dimension perceived as posing the least constraint on business activity, both in the Region and nationwide, with values of 2.48 and 2.63, respectively.
With regard to the total costs associated with compliance with information obligations, 81.3% were borne using the enterprise’s own resources (56.2% at the national level), while 18.7% resulted from the subcontracting of third parties (outsourcing) (43.8% nationwide). Registrations and notifications, as well as the provision and submission of business and tax information, accounted for the largest shares of the average annual cost of compliance with information obligations (36.4% and 25.5%, respectively), followed by cooperation with audits, controls and inspections (20.8%).
At the national level, the provision and submission of business and tax information (40.6%) and cooperation with audits, controls and inspections (21.5%) were the components with the greatest weight in the average annual cost of compliance with information obligations.
For more information, please click on:
 |
|
 |
|


![]()


|
|
|
|
|
|
Copyright © 2026 Direção Regional de Estatística da Madeira. All rights reserved.
Address: Calçada de Santa Clara 38, 9004-545 Funchal, Madeira Island
Phone: +351 291 145 126 (National landline call)
